Delaware Bay Forecasts
Delaware Bay Forecasts
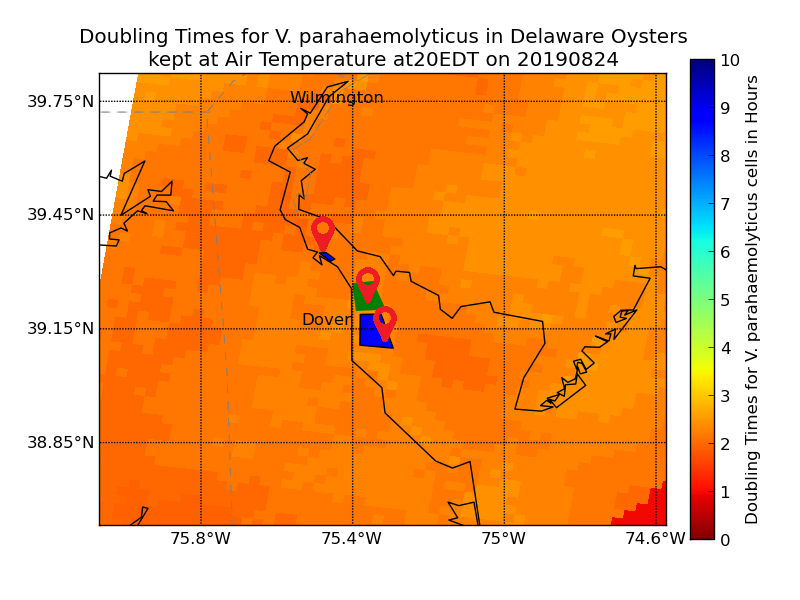
Best Harvest Window Graphs
Click one of the markers on the map to see a graph of Vp doublings in a growing area over the next 40 hours.
The Vp doublings given different cooling strategies are shown for growing areas in Delaware Bay. These graphs allow users to determine where and when the highest doubling times will occur in advance to plan harvest and cooling strategies.