Water Guidance - Vibrio vulnificus in Chesapeake Bay
Water Guidance - Vibrio vulnificus in Chesapeake Bay
Background
Vibrio vulnificus (Vv) is a species of Vibrio bacteria that can cause human illness. These tools are provided to aid public health officials in predicting Vv probability in Chesapeake Bay water. To learn more about Vibrio, consult one of these pages from the Center for Disease Control or MD Healthy Beaches.

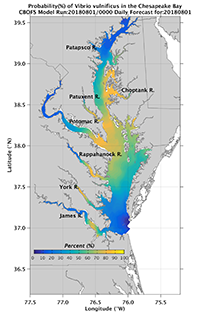
Vibrio vulnificus (Vv) Occurrence in Chesapeake Bay Water
Vibrio vulnificus (Vv) is notable for its ability to cause serious wound infections from water exposure. Predictive models created from large scale sampling efforts in the Chesapeake from 2007-2010 are forced with the Chesapeake Bay Operational Forecast System (CBOFS) to provide the probability of occurrence of this potential pathogen throughout the Bay. A daily average prediction is provided for the previous 6 days, current day, and for tomorrow.
View Model
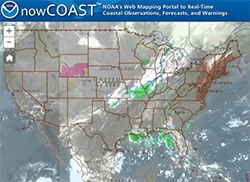
View Model on NOAA's nowCoast
NOAA's nowCoast provides a 24x7 supported display of the Vv model for the current day and next day. To bring up the daily average predictions from the Vv model in nowCoast, go to the Layer Menu on the right-hand side and select Ecological Forecasts beneath the heading for Ocean/ Estuary/ Lake Forecast Guidance. Within Ecological Forecasts, and beneath Gridded Forecast Guidance, select Vibrio vulnificus Probability for the Chesapeake Bay.
Go to nowCoast
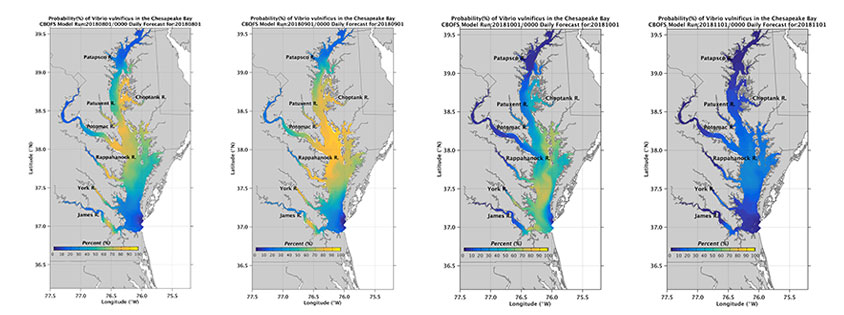
Image Archive - Vibrio vulnificus (Vv) Occurrence in Chesapeake Bay Water
Daily forecast images for the current season are archived here to aid public health
officials and physicians in matching areas of possible high occurrences of Vibrio vulnificus (Vv) with suspected illnesses.
Image Archive
Year in Review
2025 Year in Review, April 1 to November 1
2024 Year in Review, April 1 to November 1
2023 Year in Review, April 1 to November 1
2022 Year in Review, April 1 to November 1
2021 Year in Review, April 1 to November 1
2020 Year in Review, April 1 to November 1
2019 Year in Review, April 1 to November 1
2018 Year in Review, April 1 to November 1
Long-Term Archive
The model output data including Daily and Day 2 forecasts starting from April 2015 is available from NOAA NCEI.
Chesapeake Bay Vibrio vulnificus (Vv) Model Daily Monitoring
The model performance can be monitored daily by comparing the key inputs of model temperature and salinity to the observed temperature and salinity at the NOAA/CBIBS buoys that span the Chesapeake Bay. Click on the below graphs to see comparisons of the last 3 days’ daily averages. As a general rule the Vv model salinity should be within 1 practical salinity unit (psu) of the corresponding CBIBS buoy and the Vv model temperature within 2° C in order for the model predictions to be accurate with an error of 10% or less.
Buoys observations are normally not available during winter months.
Skill Assessment of Chesapeake Bay Vibrio vulnificus (Vv) Model
The model prediction of Vv occurrence is compared to the observed Vv from monthly water samples collected as part of the Chesapeake Bay Program and processed at the Cooperative Oxford Lab. Click on the graph to see the latest comparison of model predictions of Vv occurrence to observations. For more information and to see a thorough skill assessment from the 2011 season please see the NOAA Skill Assessment.
As a work in progress, current Vibrio models displayed here are considered experimental products, and thus NOAA will not be held liable from issues arising from their interpretation and use.